Using Lightroom's Histogram for Better Pictures
Understanding how the Histogram works can help you in two ways: while you’re taking a live shot and later while editing the photo. The histogram is an invaluable tool for any photographer during post-processing in Lightroom 3.

You can use the histogram to provide instant information before you take the shot to let you make on the spot adjustments to the image. As importantly, the histogram also will allow you to make changes long after you have taken the picture and are ready to make edits.
Defining the Histogram:
The histogram indicates the data of the photo and then enables you to improve the image. Below we provide tips on using Lightroom’s Histogram, but you can use these same techniques with most other photography editing software.
The Function of Histogram:
You can start by opening Lightroom, selecting an image and open the Develop Module. You’ll see a small, black/gray box open on the upper right side of your screen. We promise that it’s easier to use than it looks! Once you open the histogram, you might be tempted to return to a previous screen and directly edit a photo by hitting auto “enhance”. Stop! The Histogram adds tremendous value to an image, and it's far easier to use than it looks. It is an indispensable tool for adjusting the contrast, highlights, shadows, and overall brightness of an image to get it ready for professional printing.
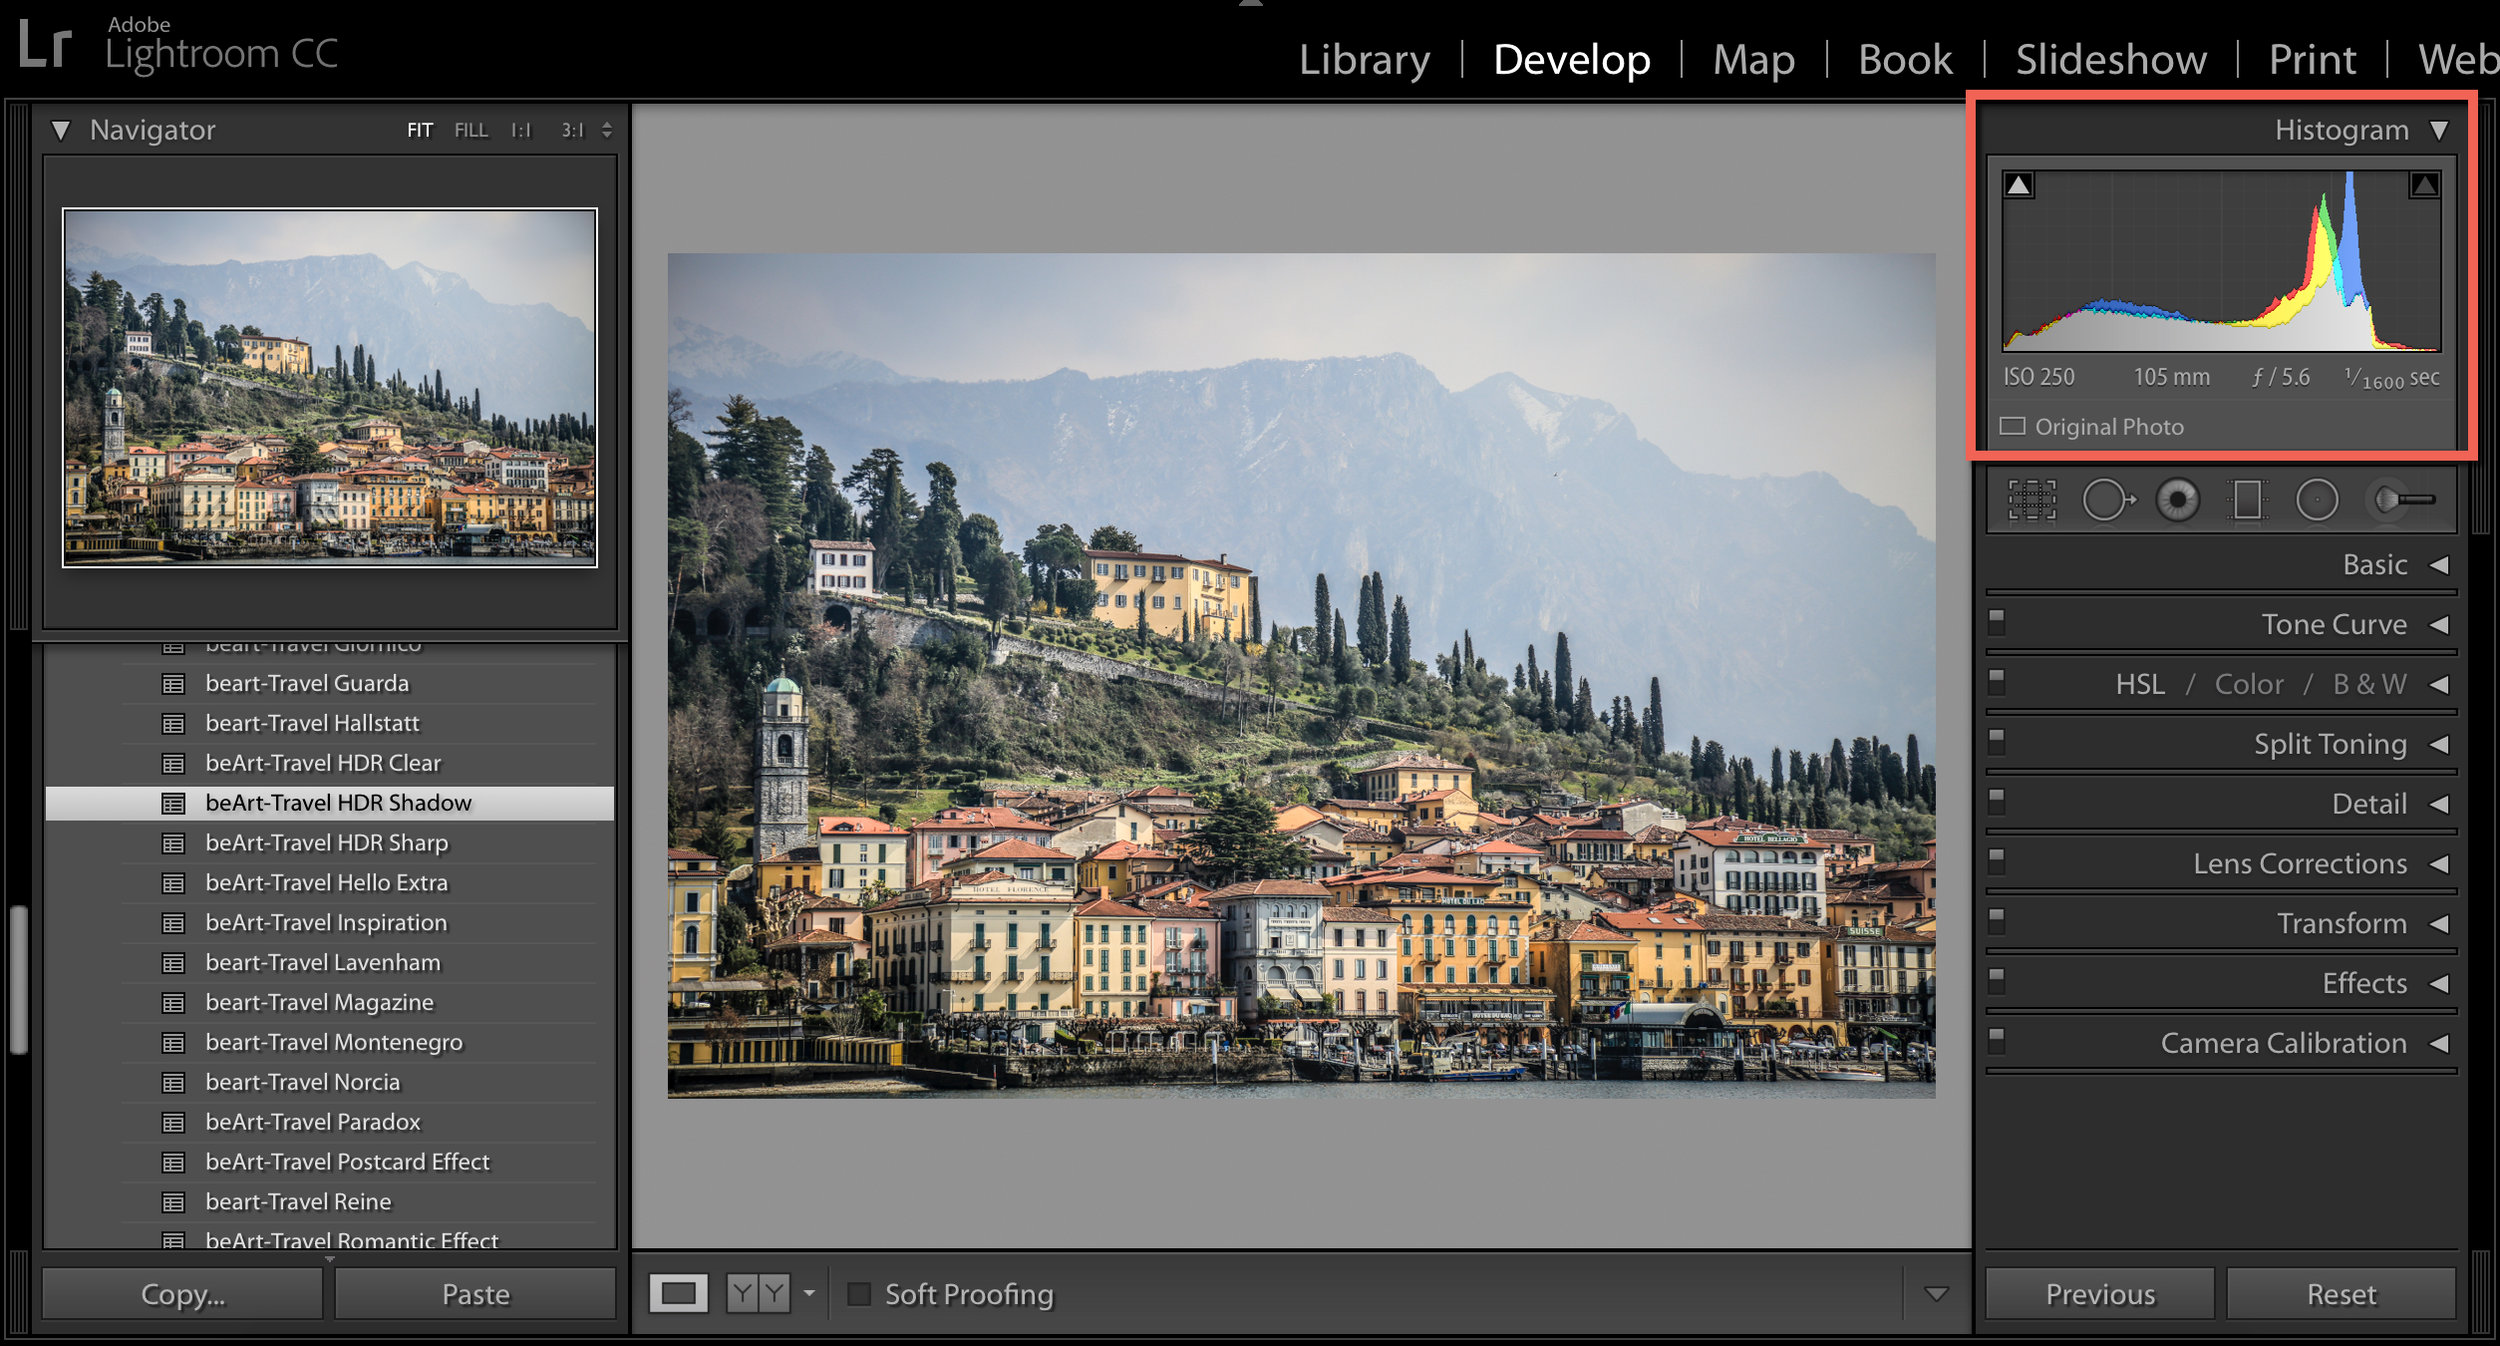
The Histogram Graph:

Do not let the rainbow graph in the histogram box intimidate you. It is only detailing individual data in your image. If you think of the graph from left to right, the left side relates to the darker (shadow) side of the picture while the right side corresponds to brightness (highlight)
So: left equals the most shaded area of your image and right side equals brighter side of your image. The peaks in your graph indicate data in your image. If it’s skewed too far to the left, for example, you’ll know that your image is leaning toward dark and details are now being clipped.
Read on to understand the importance of clipping to a picture:
How to Recognize Clipping:
Just as you pay a lot of attention to clipping with your camera, you must do the same with the histogram. Clipping occurs when the image is skewed too far one way as we just described above and you see it in the graph. For example, if the graph shows a peak edging or bleeding off of the graph, either right or left side, you’ll know data is clipped or not sufficiently included in the image. It's probably not what you want for a picture unless you're aiming for a particular effect.
If you see two peaks - one on the far left (shadow) and the other on the far right (highlight) of an image - that’s also clipping data. Most of the time, a photographer wants to see a balanced and centered graph. So what do you do?
Once you look at a graph, either while taking the photograph (ideally) or afterward during processing, you can check the image to see if you’re satisfied if there is any clipping. It might be that you want more shadow or more highlight depending on what you’re going for in your picture as we said.
Changing any clipping:
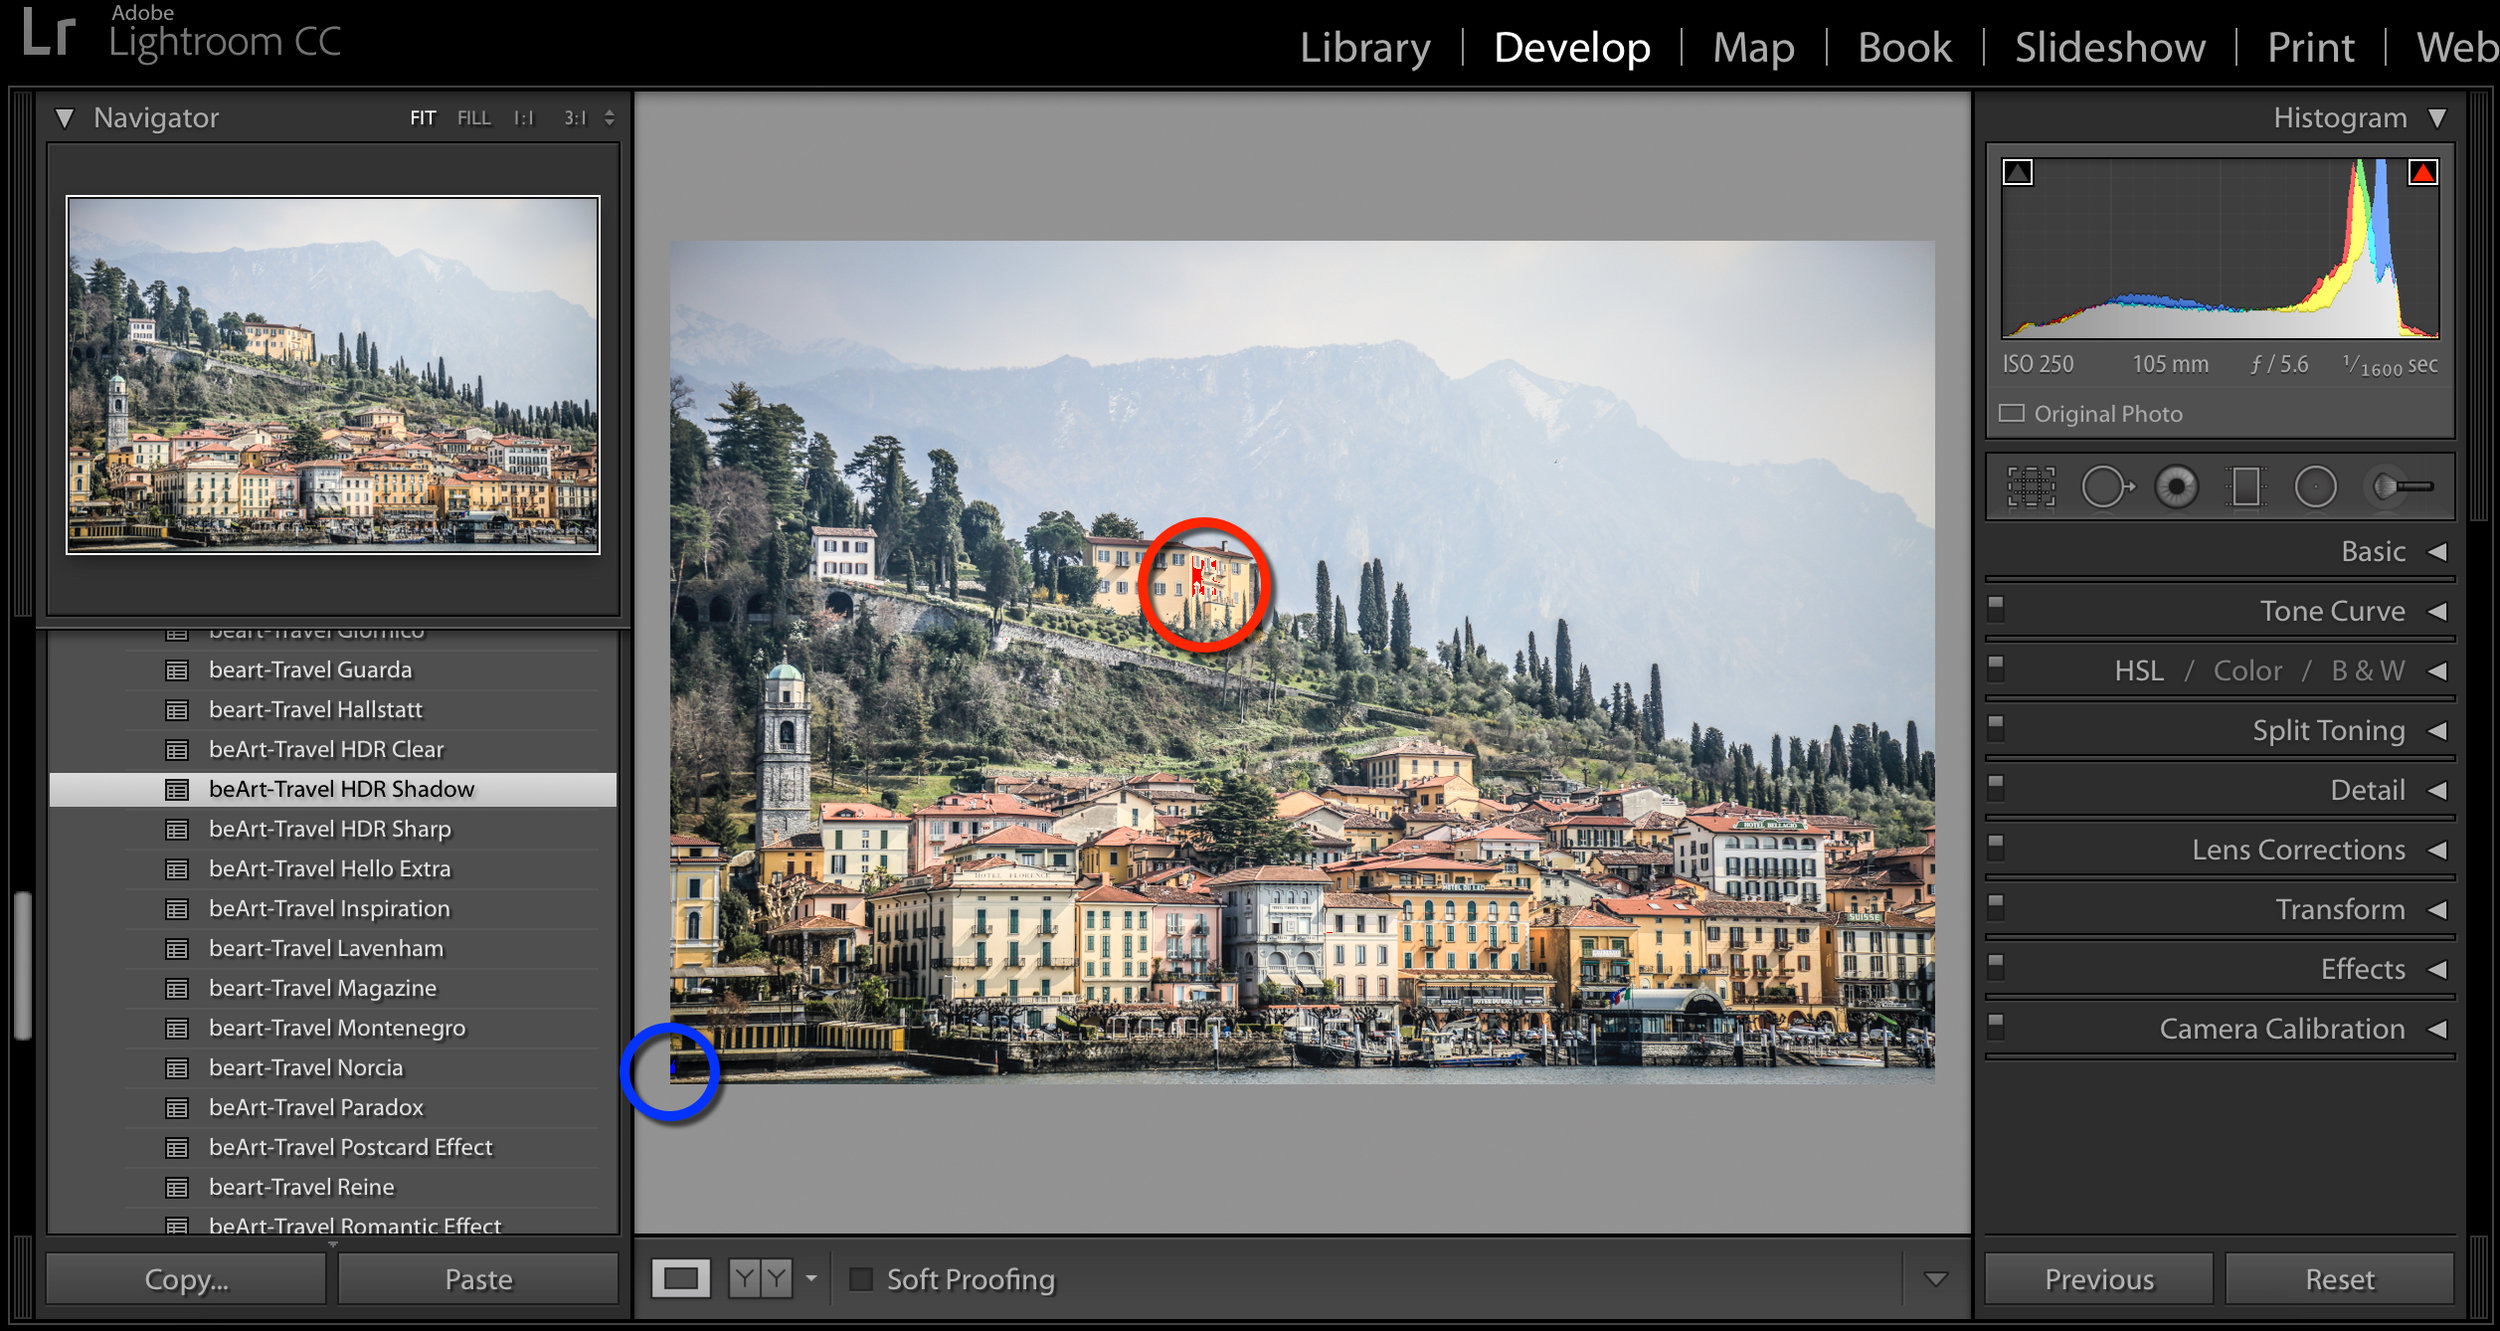
As always, we suggest you practice first with a picture. Start by making a copy of the original and training on the copy! Then, begin to make adjustments in the histogram starting small. Take an image with some unwanted shadowing. If you look at your histogram graph, you’re likely to see it indicated there as well. Note in the graph the tiny arrows on the left side showing that there is clipping.
Try moving the arrows using your mouse for highlights and you’ll see pixels in red. Now move your mouse over the arrow indicating shadows in the graph, and you see lost pixels shown in blue. Hit you “j” key, and all of the clipping will suddenly appear simultaneously. You’re able to compare highlight and shadows individually or concurrently. It's personal preference.
Now that you’ve been able to identify and see what you need to change, you’ll need to know how to tweak or repair the clipping of the image. Try hovering the mouse over the histogram and you’ll see how different items become highlighted within the graph. These are the basic four controls within Lightroom: Fill Light, Exposure, Recovery, and Blacks.
There are two ways to adjust any of these four controls:
1) You can do it directly within the graph by clicking and dragging any parts of it right or left depending on what you want for your outcome highlight or shadow.
2) Instead of working with the graph, use the controls in the Basic section of your box.
Some photographers prefer to use the graph while others prefer the Basic section. Either one works fine.
It takes practice, but you can get to that point where you will easily and quickly manipulate necessary adjustments to an image using Histogram and adjusting any clipping. Also, the better the picture is when you’re taking it, the more balanced it is in the histogram graph. This means the less time you'll spend tweaking afterward during processing and editing!
A Final Note on Histogram and Clipping:
Sometimes, it's enough just to adjust the contrast of an image in the Basic section to get the balance you want. Starting with contrast can be helpful. If it isn’t enough, then you can continue to make adjustments to highlight and shadow either in the Basic section or the graph until you get the image you want. Again, a little practice goes a long way. A lot of practice and you learn to save time when it comes to editing photos.
We would absolutely love for you to follow us on FACEBOOK and be a part of our community. Don't forget to Share your photos with us using hashtag #BeArtPresets